Easy Website Performance Test Using Free Google Lighthouse
- Updated: 2021-12-15
- Published: 2021-08-05
- Reading time: 8 minutes
- Word count: 1089
Article describes one method for testing your website performance. This is a simple process and anyone can learn it. To follow along with this guide use a Windows, Linux, or Mac operative system. Here we explain basic page speed metrics and how to use the Google Lighthouse performance tool. A performant website is better for SEO and user experience.

Fast websites load quickly on any device, anywhere in the world
A fast website is essential for an impressive user experience. Your clients and associates want to know WHAT you have to offer, and they shouldn't have to wait for a slow website.
We optimize websites for First Contentful Paint (FCP), Largest Contentful Paint (LCP), First Input Delay (FID), and Cumulative Layout Shift (CLS). We do this by serving efficient HTML, CSS, and JavaScript and deploying services over a global Content Delivery Network.
The Google Lighthouse website page speed test
There are many benchmark tools available for testing a website performance. The Google Lighthouse page speed test is one such testing tool. It is easy to use and accessible to anyone with internet access.
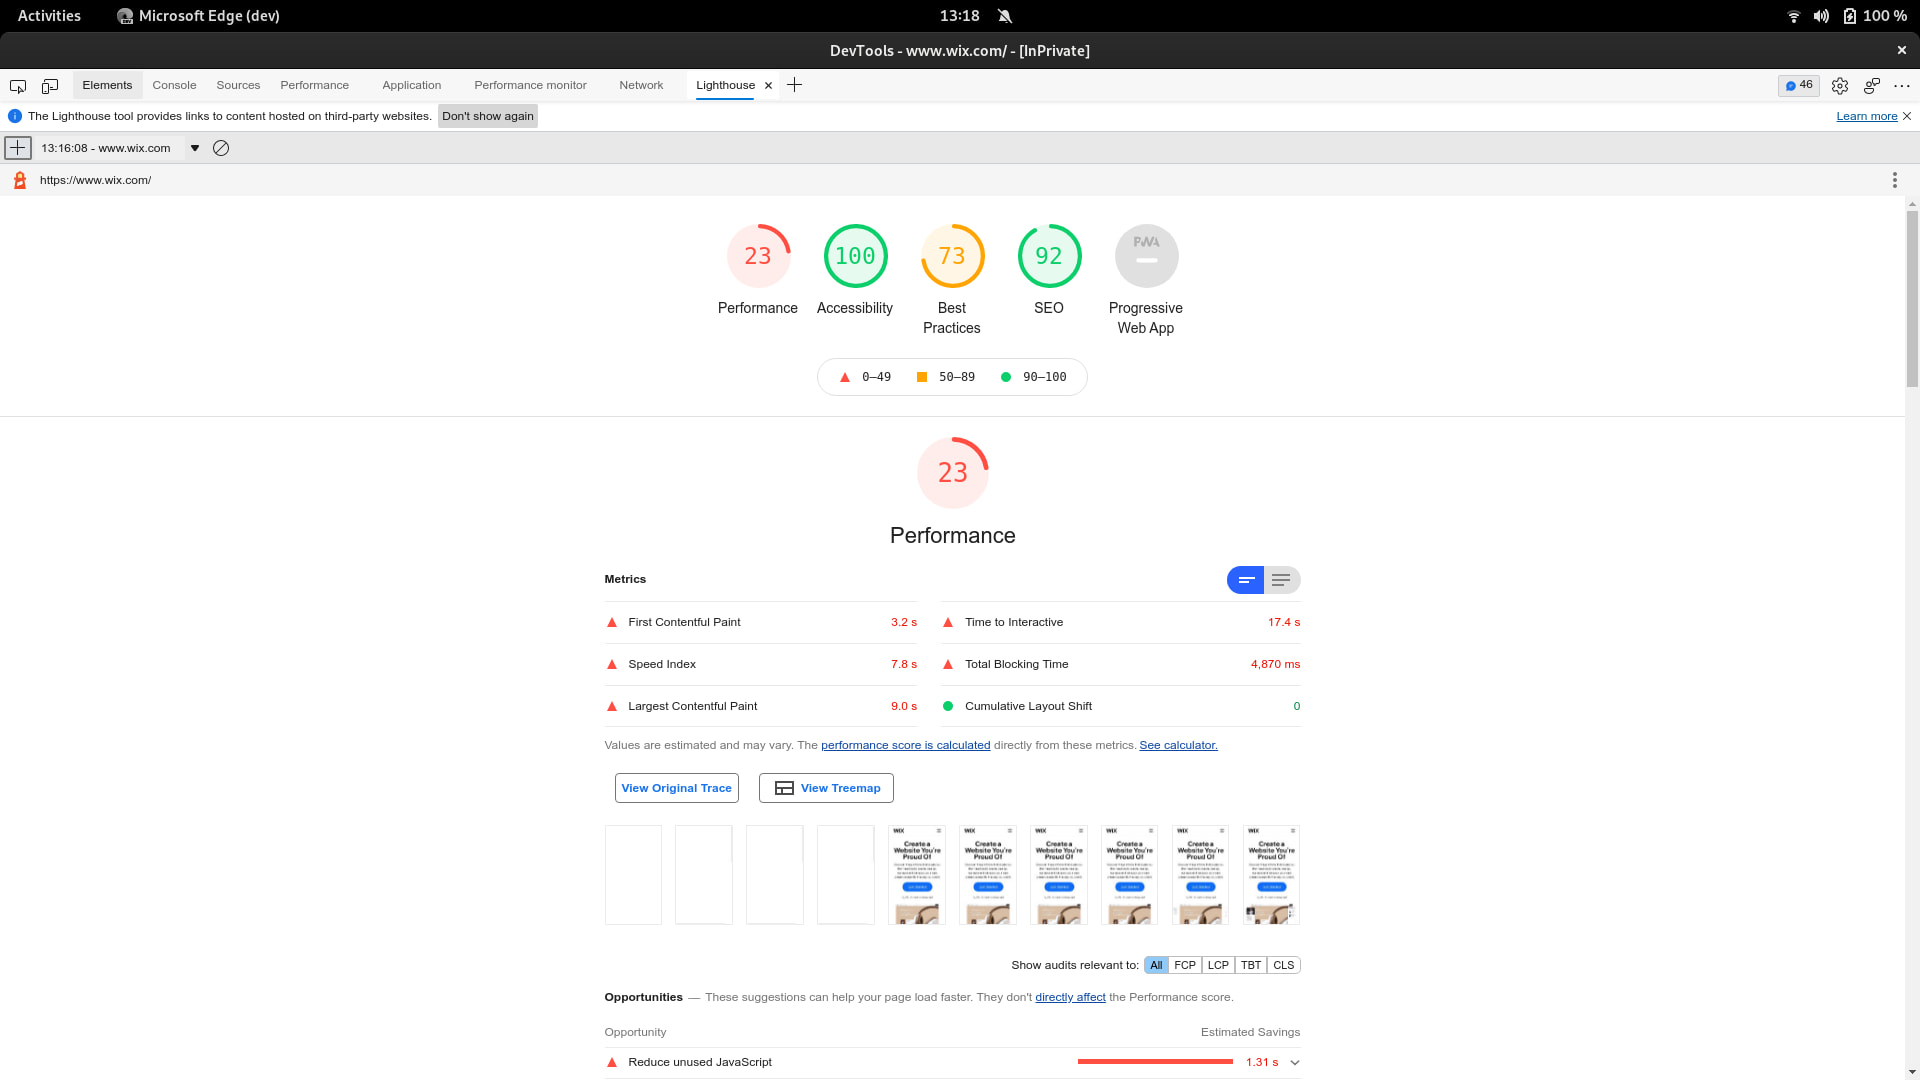
This image shows the results from the Wix homepage. It is shown here that the Wix site itself scores 23/100 in performance, 100/100 in accessibility, 73/100 in best practices, and 92/100 for SEO.
This does not mean that if you build a site on WIx you will achieve these scores. This is just the results from testing the Wix homepage on August 14, 2021.
There are many more detailed testing tools available. The Google Lighthouse score is an easy way to get started with understanding website performance testing.
How to Use Google Lighthouse on any website
There are three simple ways to run the Google Lighthouse test on any website. This article offers a brief explanation of how to test a website through the developer tools in a chromium based browser, and how to interpret the results.
Three ways to test a website with Google Lighthouse
Use the Dev Tools (explained in this article)
Go to their homepage (https://developers.google.com/speed/pagespeed/insights/)
Download the browser extension (https://chrome.google.com/webstore/detail/lighthouse/blipmdconlkpinefehnmjammfjpmpbjk)
How to use Lighthouse in Chrome or Edge
Open an incognito window to ensure no browser extensions affect your performance score. Then access the developer tools through browser menu or keyboard shortcut. Next navigate to the Lighthouse tab, and finally select "mobile device" or "desktop" and run the test.
Steps to test with Lighthouse
open an incognito browser -
Ctrl + NOpen developer tools -
Ctrl + Shift + IClick the "Lighthouse" tab
Select "performance" and "mobile device" from the options
Click Generate report
About the Google Lighthouse performance test
As with any synthetic performance test - do not read too much into it. The results can assist as a general guide but it is possible to create hacks for high test scores. The best measurement for site speed is to collect real data from real users using actual devices.
The best measurement for site speed is to collect real data from real users using actual devices.
The Google Lighthouse score can fluctuate. Generally it is best practice to take an average score from multiple test runs. However, running the test once often exposes a number of website performance flaws that can be fixed by a skilled developer.
Understanding the Lighthouse test results
In this brief overview we will look at three common metrics in website performance testing: total blocking time (TBT), largest contentful paint (LCP), and cumulative layout shift (CLS). We will then offer some brief advice on how to improve your website performance in these three areas.
Total Blocking Time (TBT)
Total blocking time (TBT) is a time measurement in milliseconds that measures the total amount of time that a page is blocked from responding to a user input (mouse clicks, screen taps, or keyboard presses).
Specifically TBT is the amount of time between the First Contentful Paint and the Time to Interactive where a task length exceeded 50ms.
...measures the total amount of time that a page is blocked from responding to a user input (mouse clicks, screen taps, or keyboard presses).
Simply this is the amount of time you have to wait until you can do something on the webpage. TBT is an important user metric to optimize for reducing user frustration with your app or website.
Recommendations to improve TBT
The process of reducing the total blocking time in order to improve the user experience generally reduces to removing excessive or unnecessary JavaScript, or writing more effecient code.
The details of how this could be done are outside the scope of this article.
Largest Contenful Paint (LCP)
Largest contentful paint (LCP) is essentially measures "perceived load speed". This is a user centric metric that can described as "how long until a user feels the page was useful."
...a user-centric metric that can described as "how long until a user feels the page was useful."
Here "feels useful" doesn't mean "feels interactive" but instead refers to the perceived experience of content loading that the user can then process cognitively.
Various measures have evolved over time to measure "perceived load speed" including: DOMContentLoaded, First Contentful Paint, First Meanginful Paint, Speed Index, etc.
Specifically LCP represents the render time of the largest image or text block visible within the viewport. Different elements are considered for LCP: images, videos, and block level elements containing text nodes or inline text elements as children.
Generally is it recommendeed to have a score LCP score or 2.5 seconds or less.
Recommendations to improve LCP
Optimizing the website LCP can be a matter of page design, asset optimization, or platform architecture. To improve LCP consider: reducing web server response time, remove render-blocking JavaScript or CSS, and reducing resource load times.
Cumulative Layout Shift
Cumulative layout shift (CLS) is another user-centric performance metric. The intent of CLS is to measure "visual stability" by quantifying how often users experience unexpected shifts in layout.
If you scroll a website trying to read something and the content jumps around - that is a bad user experience.
CLS is another actively evolving metric. It measures the largest burst of layout shift scores for every unexpected layout shift that occurs during a page lifespan. This means anytime a visible element changes its position from one rendered frame to the next.
If you scroll a website trying to read something, or click on a button and the content jumps around making the experience difficult - that is a bad user experience. It is generally a good score it CLS is measured below 0.1 seconds.
Recommendations to improve LCP
There are a few factors to consider with optimizing a page for LCP. As a general rule never insert content above existing content, always below. Use transform effects over layout changing animations. Use correct size attributes of all images and video elements.
Summary
In this introductory article we explained what Google Lighthouse pagespeed test is, and how to use it to test any website. We briefly explained three popular website performance metrics : TBT, LCP, and CLS. We also offered explicit advice on how to improve your website performance score in these area.